A key goal of the MIKELANGELO project is to improve I/O performance for both Cloud and HPC workloads. Partners are working hard to enhance hypervisors (sKVM), Guest OSes (OSv), Middleware (e.g. Torque, OpenStack, package management), and hosted applications (e.g. by leveraging Seastar).
If you cannot measure it, you cannot improve it - Lord Kelvin
But how do we know the performance is improving? How do we identify further opportunities for improvement? Belfast-born physicist William Thomson, 1st Baron Kelvin is quoted as saying “If you cannot measure it, you cannot improve it”. MIKELANGELO has dedicated some of its resources to creating a full stack instrumentation and monitoring system to help us understand and maximise the impact of our work.
Many powerful instrumentation and monitoring frameworks are in widespread use today, but all impose various constraints. Some target a particular middleware stack. Some cannot be dynamically reconfigured at runtime. Many have limitations to their extensibility. Few can handle truly cloud-scale deployments in modern data centers.
Starting with the FP7 IOLanes project, Intel’s Cloud Services Lab began working on a telemetry gathering system that could be easily extended to capture data from the full stack - hardware through host OS, hypervisor, Guest OS to hosted applications - with very low overhead. This capability plays a key role in the lab’s Apex Lake prototypes researching advanced orchestration techniques. Subsequently, as Intel’s Software Defined Infrastructure initiative gathered momentum, Intel’s Data Center Group saw the need for an open source telemetry framework that could be easily extended, easily configured, and easily managed – all at cloud scale. They built a team to make this a reality, and Intel’s Cloud Services Lab were given early access to the code in development.
Additional functionality was required to meet both the cloud and HPC needs of MIKELANGELO, but this was not an issue due to the inherent extensibility of the emerging telemetry framework. Intel’s MIKELANGELO team implemented the functionality to collect data from libvirt and from OSv, and to publish to PostgreSQL. These plugins were all completed, integrated and validated in time for the first release of this telemetry framework: snap was open-sourced and released to the public on December 2nd, 2015.
Introducing Snap
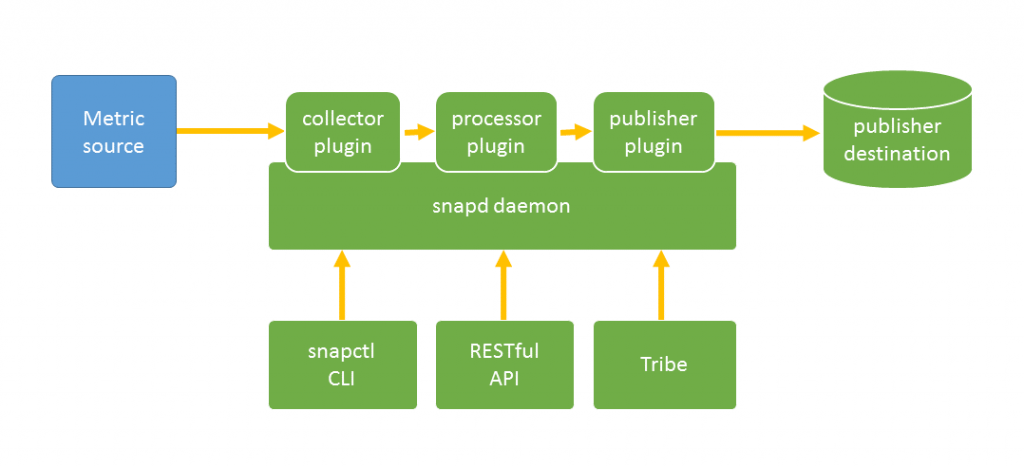
Snap is a framework that allows data center owners to dynamically instrument cloud-scale data centers. Precise, custom, complex flows of telemetry can be easily constructed and managed. Data can be captured from hardware, both in-band and out-of-band (many modern servers include dedicated management systems independent to the main CPU(s)). Software probes – snap collector plugins - can also be written to collect any metric from any software source: host operating system, hypervisor, guest operating system, middleware, or hosted application.
Captured data can be passed through local filters - snap processor plugins - that analyse and perform some action on the data.
The processed data can then be published to arbitrary destinations via snap publisher plugins. Endpoints can include SQL and NoSQL databases, message queues, or analytics engines such as Intel’s open source Trusted Analytics Platform.
Snap has been developed from the ground up to be trustworthy, performant, dynamic, scalable and highly extensible. Snap includes:
- a daemon on nodes that collect, process and/or publish data. The data can be collected from the local node, or from remote nodes.
- a dynamic catalogue of metrics, based on currently loaded plugins
- highly configurable telemetry workflows, knowns as tasks
- a command line interface that allows metrics, plugins and tasks to be manipulated
- a RESTful API for remote management
- simplified cluster-aware management via tribe
For more information on snap and its capabilities see http://intelsdi-x.github.io/snap/.
Snap functionality delivered by MIKELANGELO
For MIKELANGELO purposes we had some requirements that were not met “out-of-the-box”. These gaps were filled by developing some specialised plugins.
Libvirt Collector Plugin
This plugin collects metrics from the libvirt API that wraps around many hypervisors, including MICHELANGELO’s sKVM, to support virtualisation and host virtual machines.
The snap libvirt collector plugin can be configured to work as an internal or external collector - it can capture data from libvirt locally, or from a remote machine. Depending on the support offered by the hypervisor, it can gather up to 21 different metrics from the CPU, disk, memory and network subsystems.
The source code for this plugin is available on github.
OSv Collector Plugin
This plugin collects metrics from the OSv operating system. OSv is the key cloud guest operating system targeted for further optimisation by the MIKELANGELO project.
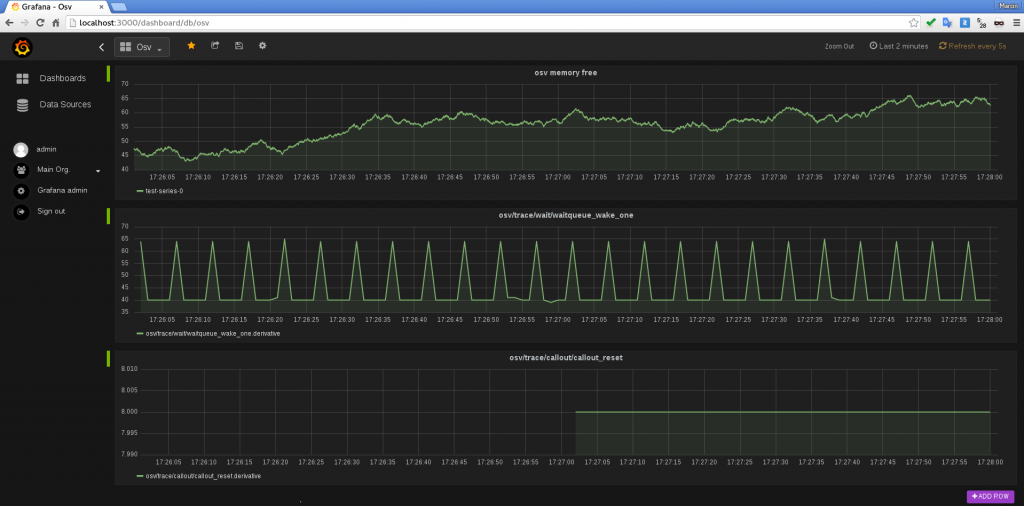
The snap OSv collector plugin has the ability to collect metrics from memory and cpu time as well as traces from the operating system. Traces are arranged into a number of groups covering virtual io, network, tcp, memory, callouts, wait-queues, asynchronous operations and virtual file systems.
In total the OSv collector plugin supports the capture of approximately 260 different metrics as described in Chapter 6 of Deliverable D2.16, The First OSv Guest Operating System MIKELANGELO Architecture. The plugin has extensive wildcard and filtering support, simplifying configuration.
The source code for this plugin is available on github.
OpenFOAM Collector Plugin
This plugin is designed to instrument an OpenFOAM deployment. OpenFOAM is a set of libraries that can be used to solve computational fluid dynamics (CFD) problems. The problem-space is typically split up into a mesh of adjacent areas, each of which can be solved independently. The metrics that can be gathered vary from case to case. In our CFD computations both initial and final values have been collected for k, p, Ux, Uy, Uz, and omega.
The source code for this plugin is available on github.
Tag Processor Plugin
This plugin allows metadata to be injected into the telemetry flows. For example, workload descriptions, unique identifiers for each run of an experiment, and configuration parameters can all be defined as tags and piped through the snap infrastructure to publisher destinations in parallel with any configured metrics. This allows configuration parameters or other metadata to be easily included in back-end analysis.
The source code for this plugin is available on github.
PostgreSQL Publisher Plugin
This plugin stores collected, processed metrics into a PostgreSQL database. PostgreSQL is a powerful scalable object-relational database management system. The snap publisher plugin for PostgreSQL developed by MIKELANGELO uses the official PostgreSQL library for Go. The plugin can handle many types of values like string maps, integer maps, boolean data types, integers, floats and strings. All maps are converted to strings.
The plugin can work in two different modes: transaction mode and single mode. Transaction mode stores data in one bulk insert including all metrics reported by the processor. Single mode uses a separate insert for each metric.
The source code for this plugin is available on github.
Coming soon…
The previous plugins are all publically available already, but here is a sneak peek at two additional plugins that will be open-sourced shortly…
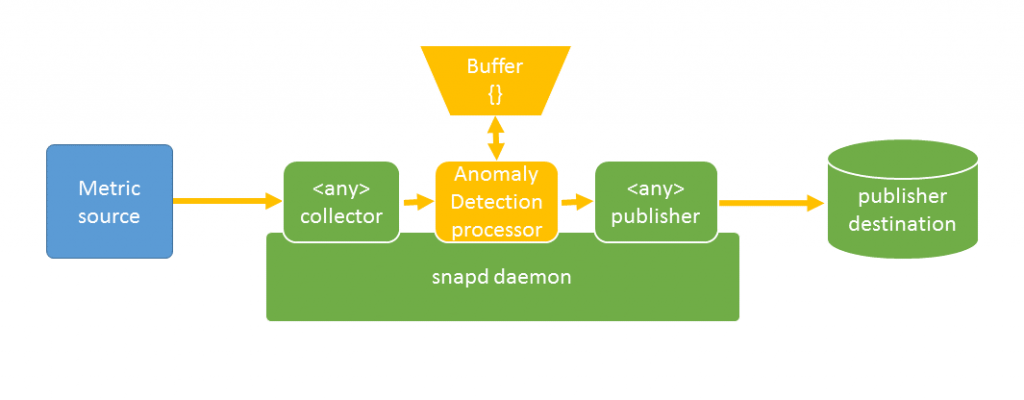
Anomaly Detection Processor Plugin
This plugin has been designed to dramatically reduce the quantity of raw telemetry data published upstream, without affecting the quality of the information being transferred. When a metric is stable then the data is only transferred occasionally - by default every 10 seconds.
However, if a statistically interesting change in the metric is detected, then all relevant metric data before, during and after the change is automatically transferred. This is possible because metrics are cached locally and analysed using the Tukey Method before the window of gathered metrics are discarded. The Tukey method was selected because it constructs a lower threshold and an upper threshold, where the thresholds are used to flag data as anomalous. The Tukey method does not make any distributional assumptions about the data.
Thanks to the flexibility of the snap architecture, the Anomaly Detection Processor Plugin can be configured to process the data coming from any collector plugin. Experiments have demonstrated a 10-fold decrease in the volume of telemetry being transmitted without affecting the usefulness of the information being published.
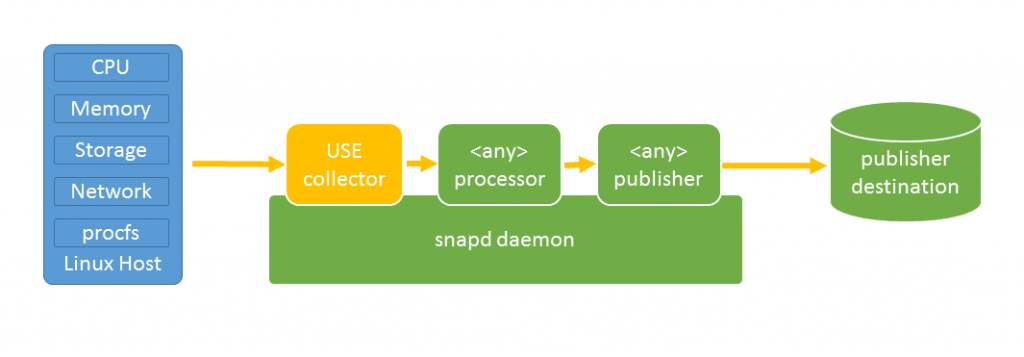
Utilisation/Saturation/Errors Collector Plugin
Inspired by Brendan Gregg’s USE method for performance analysis, this plugin will calculate the utilisation and saturation of various resources including CPUs, memory, disks and network interfaces. This will allow bottlenecks, potential misconfigurations, and a greater understanding of the load on a full deployment to be quickly identified. It will also allow strategies for more efficient placement of workloads to be developed. The plugin also facilitates any errors from the various subsystems to be gathered.
Putting it all together…
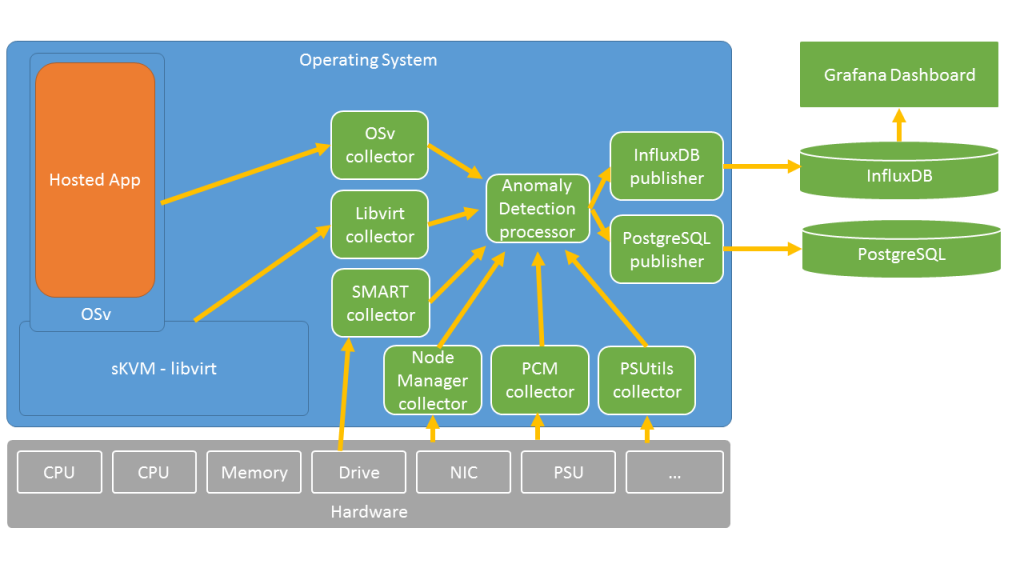
Snap has been designed to allow arbitrary flows of telemetry to be defined using the concept of task. A task file (in JSON or YAML format) defines what collector, processor and publisher plugins it uses, and how the plugins are configured. Example task files are available here. With more than 45 plugins already released open-source, it is quickly possible to construct flows of metrics such as that illustrated below.
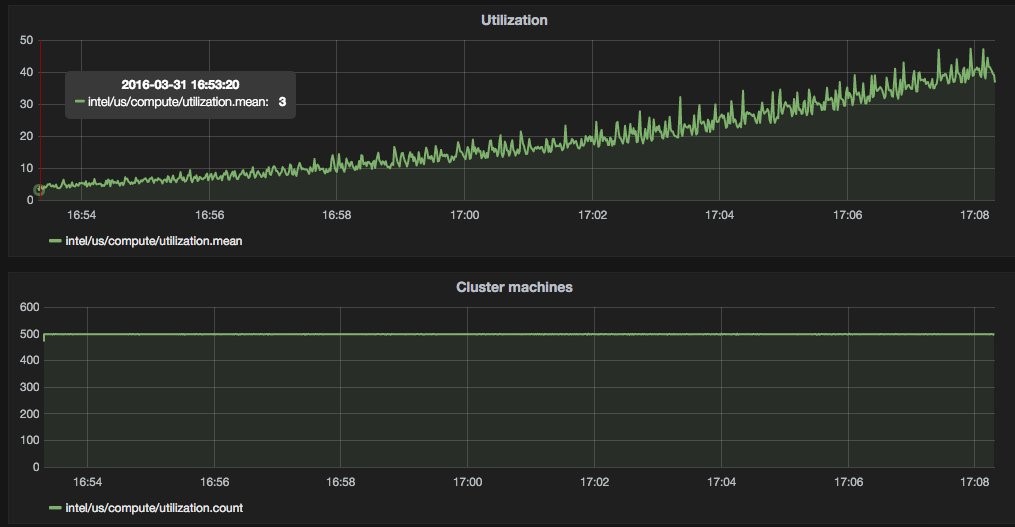
Data can be routed to OpenTSDB, a popular time-series database and front-end. By publishing to databases such as InfluxDB or KairosDB the data can be visualised via Grafana dashboards.
Complementary progress in MIKELANGELO is enhancing database technologies. ScyllaDB is a rewrite of Apache Cassandra that leverages the SeaStar libraries being enhanced by the project. It uses a shared-nothing philosophy to deliver 1,000,000 transactions per second per node, almost 10 times the performance of Cassandra. At NETFUTURES 2016 Intel’s Cloud Services Lab demonstrated that users of snap can adopt ScyllaDB as their backend if they want to leverage this performance and scalability. On a testbed instrumented by snap, metrics were fed via the KairosDB publisher plugin to ScyllaDB as the backend, and a Grafana dashboard was layered on top.
MIKELANGELO is happy to report that flexible, powerful, full-stack instrumentation of cloud-scale data centres is indeed a snap!
For complete details on MIKELANGELO contributions to snap as of December 2015 see Deliverable D5.7 First report on the Instrumentation and Monitoring of the complete MIKELANGELO software stack.
For a broad introduction to snap see http://intelsdi-x.github.io/snap/.
Community contributions are actively encouraged: See https://github.com/intelsdi-x/snap for all the details.
